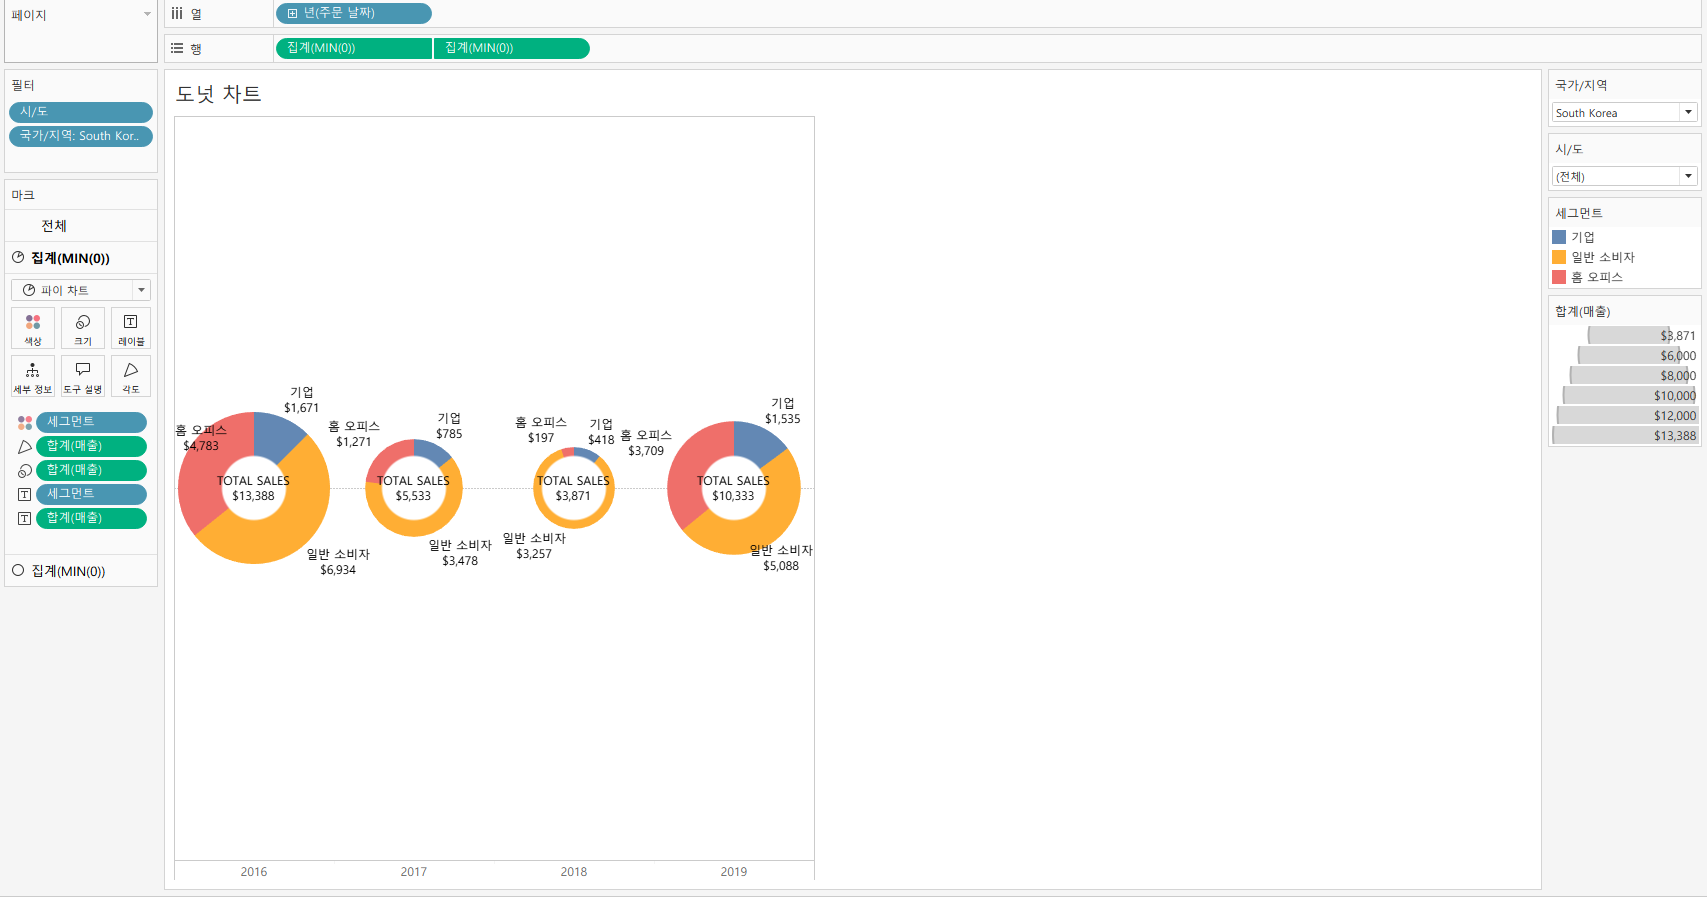
1. 국가,도시별 세그먼트 매출 파악
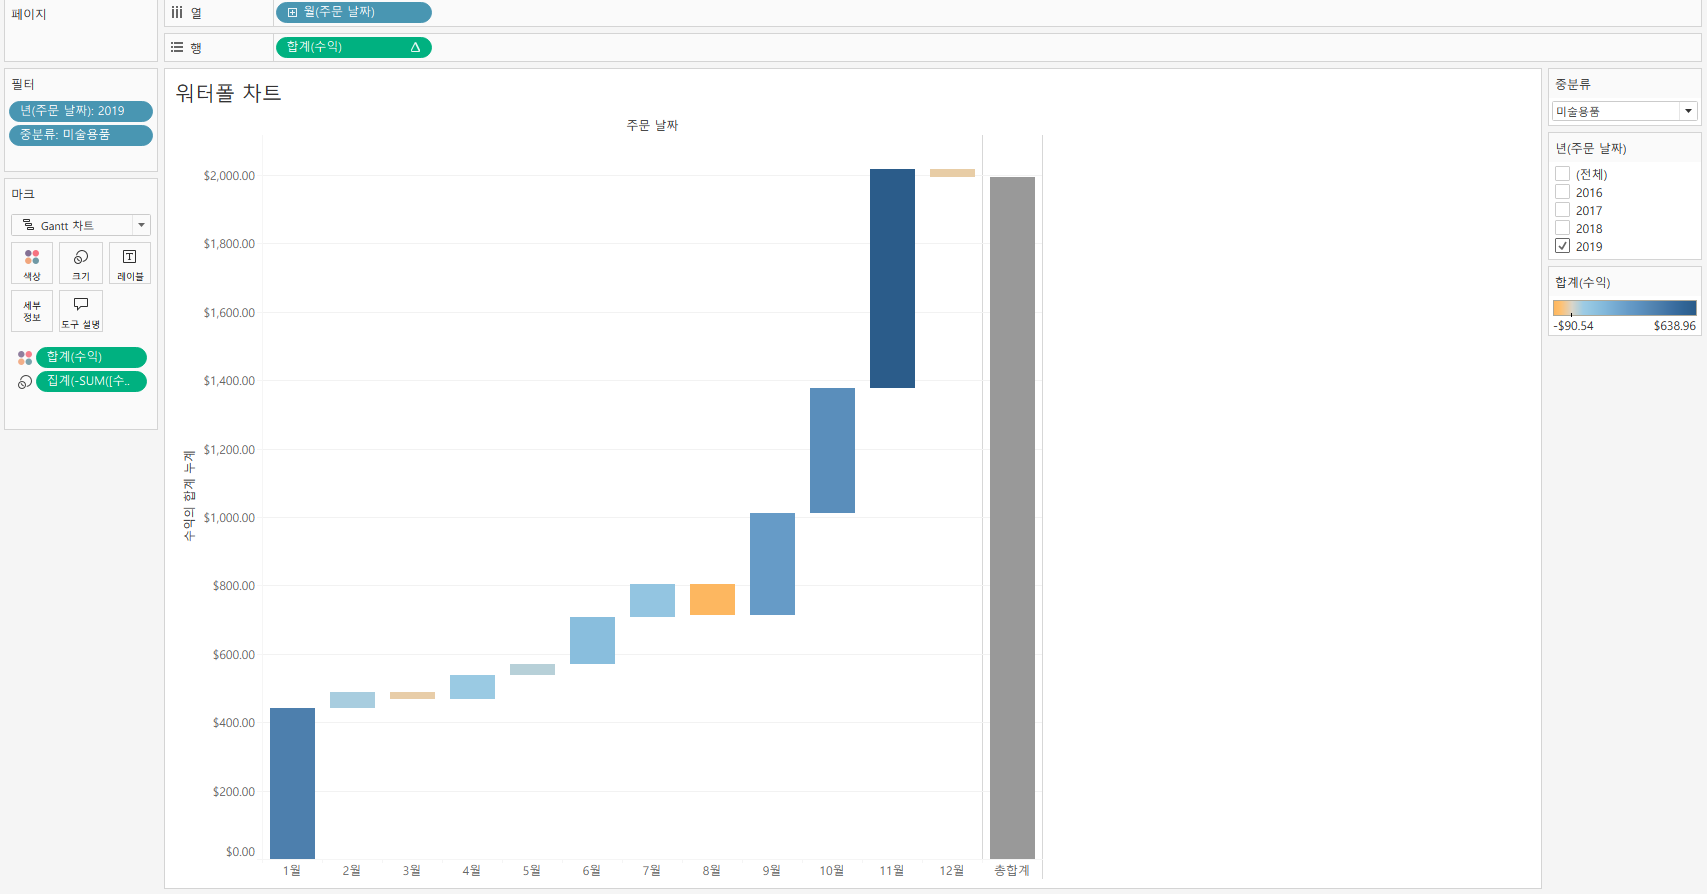
2. 년도, 중분류별 워터폴 차트를 활용하여 수익 파악
3. 분기, 중분류 별 범프차트를 활용하여 매출 파악

4. 퍼널 차트를 활용하여 사용자의 행동 파악

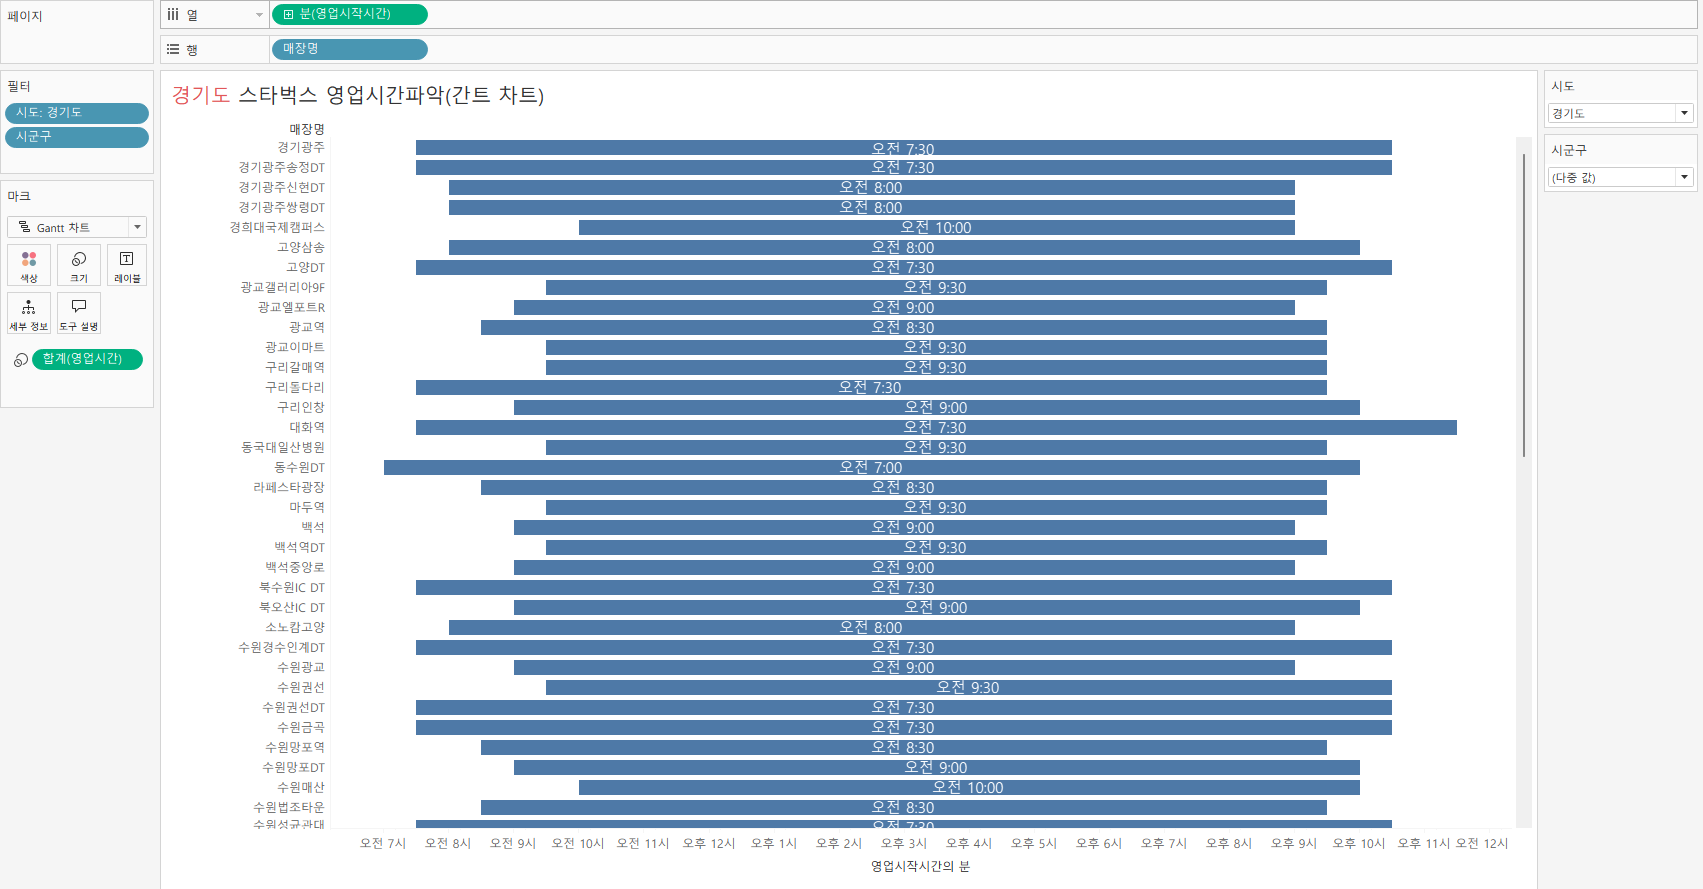
5. 시도, 시군구별 스타벅스 간트차트를 활용하여 영업시간 파악
# 도넛차트
https://interworks.com/blog/nmarques/2019/04/30/the-donut-chart-in-tableau-a-step-by-step-guide
The Donut Chart in Tableau: A Step-by-Step Guide - InterWorks
Pie charts are one of the most iconic data visualisation styles; in the past, they have been the bedrock of many a PowerPoint presentation. When you start to look a little closer, however, as many data-viz purists have, you begin to notice that they have
interworks.com
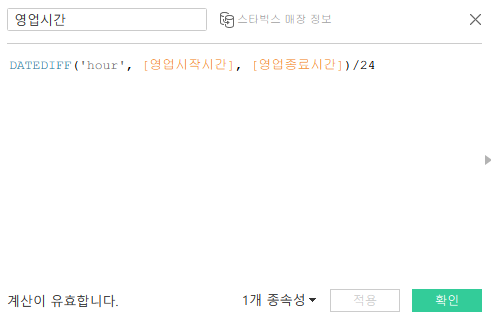
# 날짜계산 함수 (DATEDIFF함수)
https://interworks.com/blog/nmarques/2019/04/30/the-donut-chart-in-tableau-a-step-by-step-guide
The Donut Chart in Tableau: A Step-by-Step Guide - InterWorks
Pie charts are one of the most iconic data visualisation styles; in the past, they have been the bedrock of many a PowerPoint presentation. When you start to look a little closer, however, as many data-viz purists have, you begin to notice that they have
interworks.com
'취업준비' 카테고리의 다른 글
| 태블로 - 부트캠프(신병훈련소) 9일차 | 취업준비 (0) | 2025.10.23 |
|---|---|
| 태블로 - 부트캠프(신병훈련소) 8일차 | 취업준비 (0) | 2025.10.22 |
| 태블로 - 부트캠프(신병훈련소) 5일차 | 취업준비 (0) | 2025.10.17 |
| 태블로 - 부트캠프(신병훈련소) 4일차 | 취업준비 (0) | 2025.10.16 |
| 태블로 - 부트캠프(신병훈련소) 3일차 | 취업준비 (0) | 2025.10.15 |